Course Index
The MS in Business Analytics and AI residential modules are spread out over two calendar years and a period of 12 months.
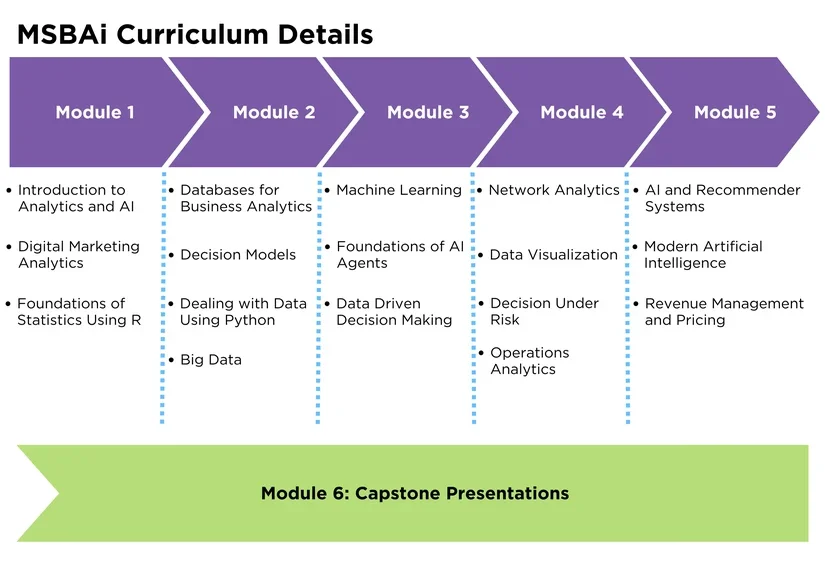
The MSBAi program curriculum focuses on four core areas of Artificial Intelligence (AI) in Business: Descriptive Analytics, Predictive Modeling, Causal Inference and Prescriptive Modeling. It is built on a foundation of fulfilling three core goals for all professionals: data engineering, data analytics, and storytelling. MSBAi exposes students to both open-source and commercial software to reflect the heterogeneity of software used in different companies. This includes, but is not limited to STATA, R, Python, and Tableau.
MSBAi Academic Director Anindya Ghose discusses the course curriculum and offers a high-level snapshot of the topics and skills covered in each module.
Learn More about the Program's Unique Modular Structure
Pre-Program / Pre-Module
Pre-Program runs from January until the start of Pre-Module 1 in March. During this time, the MSBAi program will provide matriculated students access to the Admitted Students Website, where they will be able to get more familiar with the program administration, format, logistics, as well as access optional materials to brush up on any skills prior to the Pre-Module period.
Pre-Module 1 is the period from March through April before students arrive to the in-class residential period of the module. During this time, the MSBAi program will distribute pre-readings, assignments, group work, and online sessions so that students can complete their Module 1 course work prior to the first in-class session. This period is also an opportunity for the cohort to meet each other virtually before the program convenes on campus for Module 1.
Module I
Previously taught by: Foster Provost; Alex Tuzhilin
Course description: This course addresses the data engineering foundation and predictive analytics pillar in the world of AI in Business. It will change the way you think about data and its role in business. Businesses, governments, and individuals create massive collections of data as a byproduct of their activity. Increasingly, decision-makers and systems rely on intelligent technology to analyze data systematically to improve decision-making. In many cases, automating analytical and decision-making processes is necessary because of the volume of data and the speed with which new data are generated. We will examine how data analysis technologies can be used to improve decision-making. We will study the fundamental principles and techniques of data mining, and we will examine real-world examples and cases to place data-mining techniques in context, to develop data-analytic thinking, and to illustrate that proper application is as much an art as it is a science. In addition, we will work “hands-on” with data mining software.
Topics covered: Data mining and data mining processes ○ Introduction to predictive modeling ○ Data fitting and over fitting ○ Model testing ○ Cross-validation and learning curves ○ Model performance analytics ○ Unsupervised learning and clustering ○ Bayesian reasoning and text classification
Previously co-taught by: Kristen Sosulski, Peter Lakner
Course description: This course addresses the data engineering foundation in the world of AI in Business. The purpose of this course is to ensure that students are prepared to use R as a statistical tool and understand the fundamental statistical concepts. This course is divided into two parts: 1) Getting Started with R and 2) Statistics and R.
Part 1: Getting started with R: The R portion of the course will equip students with the skills needed to work with data using the R statistical computing application. This begins with developing a basic understanding of the R working environment. Second, students will learn to use R while being introduced to the necessary arithmetic and logical operators, and salient functions for manipulating data. Next, students will be introduced to the common data structures, variables, and data types used in R. Students will learn how to develop their own R scripts and utilize the various packages available in R for visualization, manipulation, and statistical analysis. Students will learn how to import data sets and transform and manipulate those datasets for various analytical purposes such as dealing with missing data. Finally, students will learn how to create control structures, such as loops and conditional statements to traverse, sort, merge, and evaluate data.
Part 2: Statistics and R: In the second part of the class basic concepts of probability and statistics will be introduced. We shall study the concepts of population and sample, discuss the difference between population parameters and sample statistics, and draw inferences from known sample statistics to usually unknown population parameters. We shall study discrete distributions along with their means and standard deviations, paying particular attention to the binomial distribution. We shall also study continuous distributions and their probability density functions, paying special attention to the most central of the continuous distributions—the normal distribution. The Central Limit Theorem will be introduced, and confidence intervals and statistical tests will be discussed. We shall then study the simple and multiple linear regression and their applications to prediction and forecast.
Topics covered: Getting started with R (commands, arithmetic operators, logical operators, functions) ○ Data structures and types ○ Writing scripts ○ Descriptive statistics ○ Statistical graphs ○ Working and manipulating data sets in R
Previously taught by: Anindya Ghose
Course description: This course addresses the predictive analytics and causal inference pillars in the world of AI in Business. The emergence of the Internet has drastically changed business and society. Some traditional marketing strategies are now completely outdated, others have been deeply transformed, and new digital marketing strategies are continuously emerging based on the unprecedented access to vast amounts of information about products, firms, and consumer behavior. The Internet is now encroaching core business activities such as new product design, advertising, marketing and sales, creation of word-of-mouth, new start-up funding, and customer service. Our goal in this class is to discuss the new business models in the digital economy that have been enabled by Internet-based social media and advertising technologies, and to analyze the impact these technologies and business models have on industries, firms, and people. We will inform our discussions with insights from data and metrics that can guide us for measurement in causal inference.
Topics covered: Causality ○ Econometric regression modeling ○ Experimentation ○ Endogeneity ○ Econometrics-based tools
Module II
Previously taught by: Panos Ipeirotis
Course description: This course addresses the data engineering goal in the world of AI in Business. Databases are ubiquitous in all businesses and hold significant amount of information about the business. Every data analysis and report typically starts with an SQL query, as SQL is the lingua franca of all database systems. Therefore, SQL is a necessity for anyone who needs to analyze data as part of their job, and many tech companies consider knowledge of SQL a prerequisite for all their analysts and managers.
This database class is designed for absolute beginners and teaches students how databases are structured and how to write SQL queries that retrieve data from a database. The class is heavily hands-on, with a focus on developing the necessary skills for writing SQL queries. We will cover the following topics:
- Basics of Entity-Relationship model, and the connection to databases
- USE, DESCRIBE queries, to understand the structure of a database
- Selection queries: *, column, column AS, DISTINCT, ORDER BY, LIMIT
- Filtering data using “where”: Boolean conditions, IN, BETWEEN, LIKE
- Join queries: Inner and Outer joins, self joins
- Aggregation queries: GROUP BY, SUM, AVG, MAX, MIN, etc
At the completion of this course, students will be able to navigate relational databases, issue queries against databases in an organization, and generate data that can be used for analyses and reports.
Previously taught by: Panos Ipeirotis
Course description: This course addresses the data engineering goal in the world of AI in Business. All analytics projects rely on data. A crucial step in a business analytics process is creating the dataset that will be analyzed. Unfortunately, the vast majority of the stakeholders do not pay serious attention at this step; however, streamlining and understanding the data often takes 90% of the effort and time of a data analytics project. Furthermore, because most people do not know how the dataset was created, they miss important details and assumptions that were part of the data gathering and handling process, leading to serious problems down the road. This class is designed to teach students to handle data programmatically, without being software engineers. This course guides students through the whole data management process, from initial data acquisition to final data analysis. From a tools perspective, we cover the Python ecosystem: Python serves as a great general-purpose programming language for a wide variety of data management tasks, and is commonly used as the “glue” that brings together all the different aspects of the analytics process.
Previously taught by: Jiawei Zhang; Ilan Lobel
Course description: This course addresses the prescriptive analytics pillar in the world of AI in Business. It trains students to turn real-world problems into mathematical and spreadsheet models and to use such models to make better managerial decisions. This is a hands-on course that focuses on modeling business problems, turning them into Excel spreadsheet models and using tools like Solver and Crystal Ball to obtain solutions to these managerial problems. The course focuses on two classes of models: optimization and simulation. The application areas are diverse and they originate from problems in finance, marketing and operations. We cover problems such as how to optimize a supply chain, how to price products when faced with demand uncertainty, and how to price exotic financial options using Monte Carlo simulation.
Topics covered: Linear and linear integer programming ○ Nonlinear programming and evolutionary solver ○ Simulation and optimization ○ Multi-period linear programming ○ Monte Carlo simulation
Previously taught by: Norm White; Ramesh Shankar
Course description: This course addresses the data engineering foundation in the world of AI in Business. This course offers an in-depth hands-on exploration of various cutting-edge information technologies used for big data analytics. The course will cover background readings on the theoretical foundations of Hadoop and MapReduce, as well as business articles on how Hadoop and related technologies are used by companies. The course will also cover some basics of navigating Google Cloud Platform (GCP) for uploading and analyzing data using Google Cloud Storage, BigQuery, and PySpark on Dataproc (Hadoop cluster). Students have the opportunity to be hands-on with Hadoop – specifically, Linux, Hadoop distributed file system (HDFS), Apache Sqoop, Apache Pig and Apache Hive – for data management and extract-transform-load (ETL) operations. Students will also learn about cloud file storage using GCP, querying cloud data, visualizing cloud data, and using PySpark to run analytics on cloud data.
Topics covered: Big data ○ System architecture and ecosystems ○ Data management and extract-transform-load operations ○ Linux, Hadoop, MapReduce, Apache Sqoop, Apache Pig, Apache Hive
Module III
Previously taught by: Luis Torgo; Ravi Bapna
Course description: This course addresses the predictive analytics and causal inference pillars in the world of AI in Business. This course is about gaining exposure to core machine learning techniques and their applications to business domains and functions. MIT research shows 9% higher top line and 26% higher net margins for companies with ‘Leading Digital’ capabilities. While most firm have capabilities in summarizing the data they have, very few have the analytical abilities to gain true insights from such data to get business results. The course will expose you to the art-of-the-possible with respect to state-of-the-art methods and applications of supervised and unsupervised machine learning. The majority of the course will focus on supervised machine learning for prediction it will be driven practical uses cases and use a mixture of lecture, discussion of key issues, and an in-class group prediction contest over the three days. At the end of the course all students will become excellent at understanding the power of data mining to create business value. Students will learn how to identify opportunities of using supervised and unsupervised machine learning methods, setup the problems correctly, develop intuition of how the major classes of machine learning algorithms work, and how to use the appropriate metrics and approaches to judge performance. The course will also cover the important topic of algorithmic bias and examine ways to correct for it. Finally, the course will look at explainable AI and the interface between machine learning and causal inference to estimate heterogeneous treatment effects.
Topics covered: Data pre-processing (dealing with unknown values) ○ Defining the data mining task ○ Classification approaches ○ Performance estimation for time series models ○ Modeling and performance estimation ○ Model outcomes and model selection
Course description: AI is rapidly transforming the business world, and understanding the language of AI and the fundamentals of how it works is increasingly becoming table stakes across many jobs. Agentic AI extends large language models (LLMs) beyond passive chatbots into active agents capable of taking actions in the real world to improve business processes and workflows. In this course, we explore the underlying principles of building effective AI agents. Students will learn to make design decisions in order to architect better agent AI solutions. The course culminates in a demo day where students present the AI agents they built to solve business problems of their choice.
Previously taught by: Vishal Singh; Rob Seamans
Course description: This course addresses the causal inference pillar in the world of AI in Business. In every aspect of our daily lives, from the way we work, shop, communicate, or socialize, we are both consuming and creating vast amounts of information. More often than not, these daily activities create a trail of digitized data that is being stored, mined, and analyzed by firms hoping to create valuable business intelligence. With technological advances and developments in customer databases, firms have access to vast amounts of high-quality data which allows them to understand customer behavior and customize business tactics to increasingly fine segments or even segments of one. However, much of the promise of such data-driven policies has failed to materialize because managers find it difficult to translate customer data into actionable policies. The general objective of this course is to fill this gap by providing students with tools and techniques that can be utilized for making business decisions. Note that this is not a statistics or mathematics course. The emphasis of the class will be on applications and interpretation of the results for making real life business decisions.
Topics covered: Regression-based model development ○ Capturing non-linear effects: dummy variables & log transformations ○ Estimating & Interpreting log demand models ○ Using log-regressions to understand competitive marketplace
Module IV
Previously taught by: Arun Sundararajan
Course description: This course addresses various applications in the world of AI in Business. Social media and mobile commerce create massive connected data sets that contain a wealth of business and social insights. This course will translate cutting-edge network science research into actionable analytics strategies for dealing with big data that is networked, text-intensive and unstructured, with applications from viral marketing, A/B testing and media planning.
Topics covered: Network basics ○ Strength and trust in social networks ○ Measuring and interpreting network position ○ Community structure in networks ○ Identifying and measuring contagion in networks
Previously taught by: Gustavo Vulcano; Ilan Lobel
Course description: This course addresses the prescriptive analytics pillar in the world of AI in Business. Analytics is “the scientific process of transforming data into insight for making better decisions.” For example, sales data can help us understand consumer purchase behaviors as well as demand patterns. These insights can be used to make sales forecasts, which in turn can inform assortment and production planning decisions. Optimization models have played a very important role in turning “insights” into “decisions” for companies in various industries: advertising, airlines, energy, investment and finance, marketing, manufacturing, retailing, etc. This course is aimed at enriching the student exposure to business analytics techniques. It has two main parts. The first part covers sensitivity analysis, which is a follow-up of the linear programming topic covered in the Decision Models course, and which relates to understanding the impact of changing the parameters of a model on the optimal solution. It is executed using Excel Solver. The second part, which spans most of the course, covers decision making under uncertainty. Students will learn how to build optimization models that incorporate random parameters (e.g., stochastic demand, price, etc.).
Topics covered: Sensitivity analysis for linear programming ○ Decision analysis ○ Two-stage stochastic optimization with recourse ○ Dynamic programming
Previously taught by: Kristen Sosulski
Course description: This course addresses the descriptive analytics pillar in the world of AI in Business. This course is an introduction to the principles and techniques of data visualization. Visualizations are graphical depictions of data that can improve comprehension, communication, and decision making. In this course, students will learn visual representation methods and techniques that increase the understanding of complex data and models. Emphasis is placed on the identification of patterns, trends and differences from datasets across categories, space, and time. This is a hands-on course. Students will use several tools to refine their data and create visualizations. These include: R/RStudio, Python, Tableau, ThinkCell for PowerPoint, Geocodio, and Excel.
Topics covered: Design principles for charts and graphs ○ Creating data displays ○ Designing effective digital presentations ○ Visualizing categorical data ○ Time series data, multiple variables, and geospatial data ○ Dashboard design ○ Web-based visualizations
Previously taught by: Harry Chernoff; Maxime Cohen
Course description: This course addresses the causal inference and prescriptive analytics pillar in the world of AI in Business. This course is an introduction to the principles and techniques of operations analytics. Operations and supply management is defined as the design, operation, and improvement of the systems that create and deliver the firm's primary products and services. In this course, students will learn operations models and techniques that work with large data sources. Operations management has dealt with applying analytics for many years. Recently, however, due to big data, many older models and software are incapable of running the analyses. This course will demonstrate the application of Operations models that are currently being used in industry incorporating big data.
Topics covered: Process flow ○ Process design and analysis ○ Inventory ○ Project management ○ Quality, value and cost
Module V
Course description: This course offers an in-depth exploration of the design, development, and deployment of modern recommender systems and advanced AI techniques. Students will master both theoretical foundations and practical applications of key topics, including causal inference, advanced predictive modeling, ensemble methods, and big data challenges. By the end of the course, students will gain the expertise needed to design and implement robust, scalable AI-driven systems, equipping them to solve complex business analytics problems.
Previously taught by: Alex Tuzhilin; Xi Chen
Course description: This course addresses the predictive analytics pillar in the world of AI in Business. The purpose of this course is to provide the students with systematic introduction to the recent developments in AI through the coverage of fundamental AI concepts, practical business applications and the hands-on experiences with modern AI frameworks, such as Weka.
Topics covered: AI's fundamental concepts and methods ○ Deep Learning frameworks ○ Learning how to apply AI-based methos to solving practical business problems ○ Understand future of AI technologies over next few years
Previously taught by: Rene Caldentey; Gustavo Vulcano
Course description: This course addresses the prescriptive analytics pillar in the world of AI in Business. Revenue management and Pricing (RMP) focuses on how firms should manage their pricing and product availability policies across different selling channels in order to maximize performance and profitability. One of the best-known applications of PRM is yield management whereby airlines, hotels, and other companies seek to maximize operating contribution by dynamically managing capacity over time. Building on a combination of lectures and case studies the course develops a set of methodologies that students can use to identify and develop opportunities for revenue optimization in different business contexts, including the transportation and hospitality industries, retail, media and entertainment, financial services, health care and manufacturing, and others. The course places particular emphasis on discussing quantitative models needed to tackle a number of important business problems including capacity allocation, markdown management, dynamic pricing for e-commerce, customized pricing, and demand forecasts under market uncertainty, to name a few.
Topics covered: Demand segmentation ○ Price differentiation ○ Constrained pricing ○ Marginal value of capacity ○ Network revenue management ○ Pricing policies in action ○ Demand forecasting and data analysis
Module VI
The Capstone project, which students work on throughout the year, is presented at the culmination of the program. This integrative exercise gives students an opportunity to review and interpret data through statistical and operational analysis with the use of predictive models and the application of optimization techniques. The result is a unified and practical case presentation on a topic of the group's choosing. This is a team-based project with approximately 4-5 students per group. The integrative projects should not take the form of formal dissertations or narrative papers. Rather, they should take the form of “reports to management,” emphasizing substance over length and the forest over the trees. Where possible, they should be action-oriented and framed in terms of business policy and competitive strategy. Given this format, they should be easily convertible into PowerPoint presentations.
To review more information on past projects, visit our Capstone page.
Authoritative curriculum information can be found exclusively in the University Bulletin. All other content, including this page, is for informational purpose only. You can find the curriculum for this program on this page of the Bulletin.