
Measured Risk vs. Real-World Risk: What V-Lab Data Tells Us - August 28, 2026
There are fascinating disconnects between risk priced in financial markets today and perceived global risks; these disconnects are strikingly evident in data on V-lab – the analytical risk platform of the NYU Stern Volatility and Risk Institute (VRI).
Lately financial, geopolitical, climate, cyber and health risks – all topics we cover in the VRI -- have been rising. But while we think that there are many risks in the economy and financial system, with a couple of notable exceptions, the market does not. Put differently, V-Lab data accurately measure how risk is priced in financial markets, but many markets are not – yet – pricing a variety of real-world risks.
We used the V-Lab Model Context Protocol Server or MCP with Claude to ask: Please show data from V-Lab that depict how measured risk in financial markets -- in terms of volatility and option prices - is disconnected from today's risks. Here are some answers:
Every V-Lab market-based risk measure currently agrees: measured risk is low. S&P 500 realized volatility and the COVOL cross-market stress index both sit near their 2015–present medians. Total SRISK — the U.S. financial sector's modeled capital shortfall in a severe downturn — is near cycle lows at $355B, far below its 2020 and 2023 absolute peaks, and even further below its level relative to the financial system. SRISK capacity, the sector's equity cushion against losses, is at a record $2.09T. And the model's own probability of a systemic crisis has fallen to a record low of 1.0%.
None of these series show tension with each other — they all point the same direction. The disconnect in this document is about is a different one: between this entire family of market-priced risk measures and whatever risks exist in the world that markets have not yet priced. SRISK, COVOL, and implied/realized volatility are all derived from market prices — they can only reflect risk once it starts moving prices. Slow-building or off-market risks (concentration in a handful of mega-cap stocks, private-credit and AI-capex leverage sitting outside public balance sheets, geopolitical shocks) do not show up in any of these figures until a market event forces repricing.

Recently, and notably, however, two asset classes are beginning to signal growing risk of unsustainability. The most important is in markets for sovereign debt. For example, US 10-year Treasury note yields recently rose past 4.7% in part over rising concerns about fiscal unsustainability, triggering announcements by the US Treasury to increase the size of buybacks in order to contain the rise.
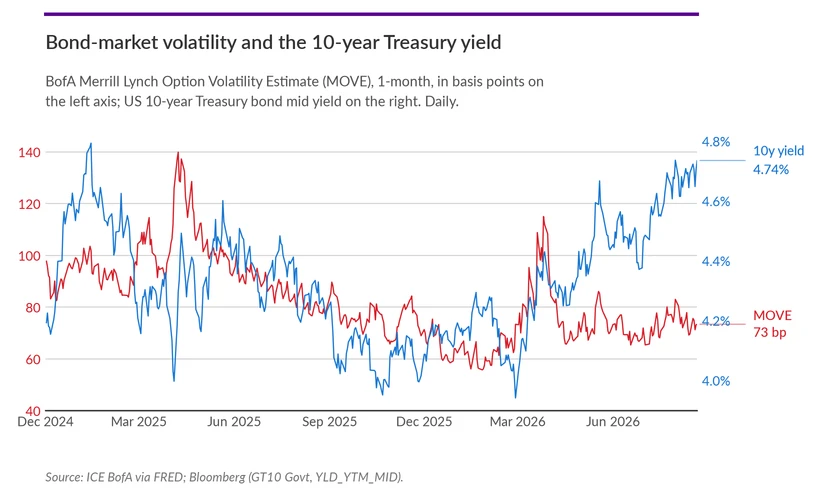
Yet unlike during previous risk-off events, standard measures of volatility in the Treasury market (e.g., the MOVE index) show little sign of rising risk. It’s also noteworthy that the rise in yields does not appear to represent concerns about inflation. Market-based breakeven inflation measures have been largely stable in a 2% - 2-1/2% range, despite increasingly hawkish commentary from a number of Fed officials about the need to bring inflation back to the Fed’s 2% target.
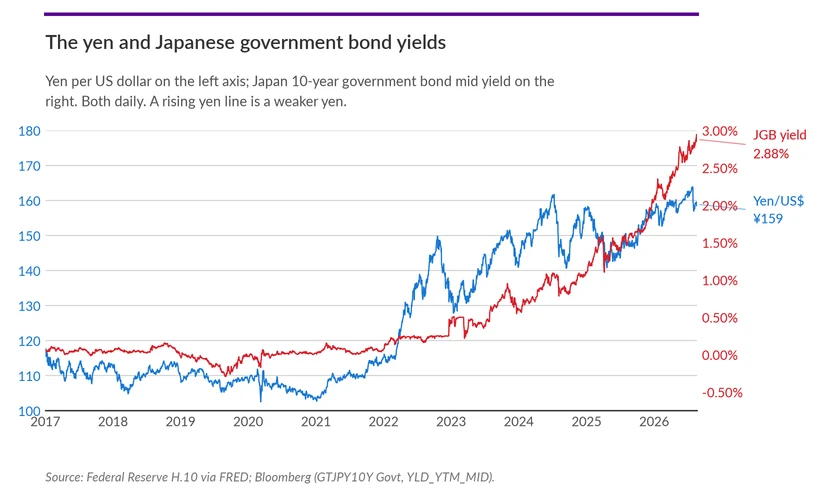
The rise in yields is not limited to the US market; it is global. For example, inflation is rising in Japan, and the Bank of Japan is hesitant to tighten monetary policy over economic concerns. As a result, the Yen has weakened against other currencies including the dollar, and Japanese government bond yields have risen significantly. To help stabilize the Yen, without having an impact on US yields, the US Treasury intervened by buying Yen financed with sales of euros. Yields on European and UK debt have also risen appreciably.
The other asset class showing increased signs of risk and volatility is the Korean stock market (KOSPI 200). The market soared with the rising earnings of AI-related companies. To quote the Wall ST Journal: The benchmark Kospi index more than tripled in value, driven by faith in the AI boom. Two South Korean companies, memory-chip makers Samsung Electronics and SK Hynix, soared to trillion-dollar valuations and became the twin forces pushing record market gains. Then the Kospi plummeted around 40% over six weeks in June and July, burning hundreds of thousands of investors—a sober warning to those betting big on the AI industry. The roller-coaster ride has continued: The Kospi has since rebounded about 20% from its low.
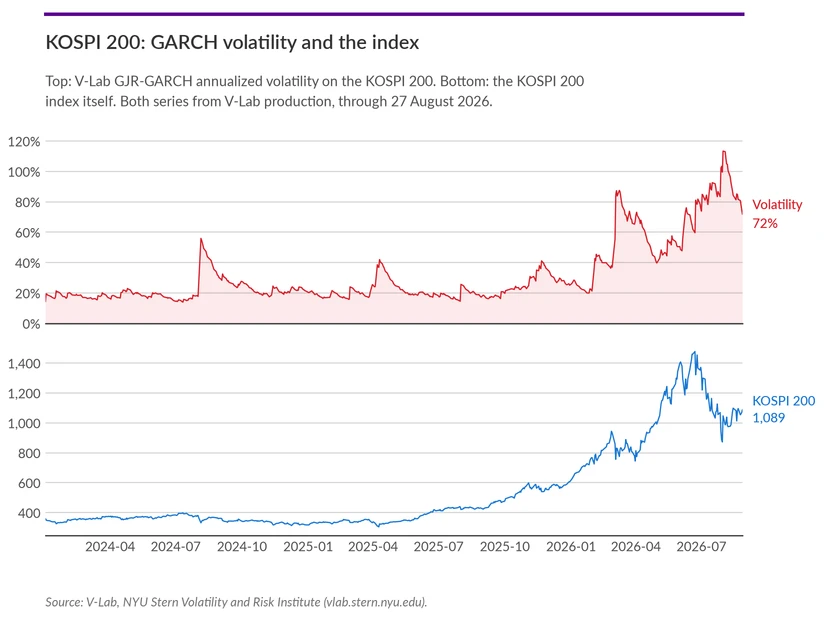
We wonder if this is a warning sign about the sustainability of the AI boom, now driven by leveraged financing by the “hyperscaler” firms.
1. Priced risk: volatility and cross-market stress near historical medians
GJR-GARCH annualized volatility on the S&P 500 is currently 11.7%, the 42nd percentile of its distribution since 2015. V-Lab's COVOL composite — a cross-market indicator of how synchronized volatility is across countries, asset classes, oil & gas, and commodities — reads 31.0, the 40th percentile over the same window. Neither series signals unusual calm or unusual stress; both sit close to their historical medians.
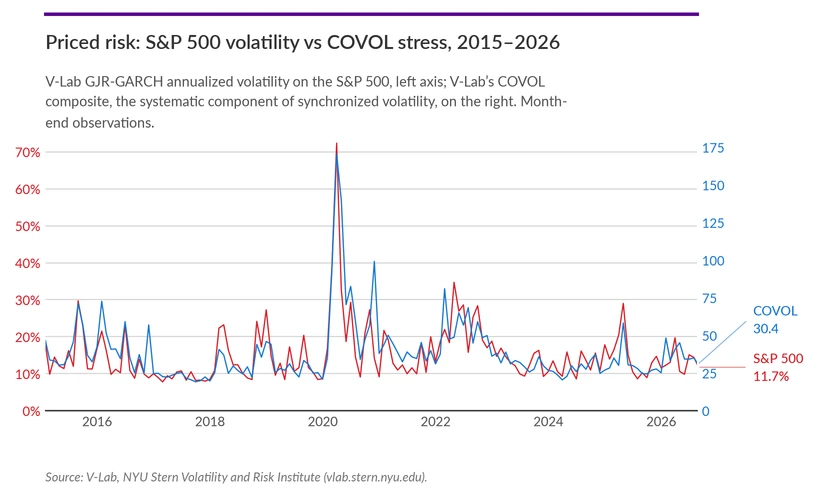
2. Total SRISK: the actual modeled shortfall is near cycle lows
Total SRISK is the capital the U.S. financial sector is modeled to need in a severe market decline. At $355B it sits at the 34th percentile of the 2015–present range — well below the ~$900B–$1.1T peaks reached during the 2020 COVID shock and the 2023 regional-banking stress episode. This is a decline, not a build-up.
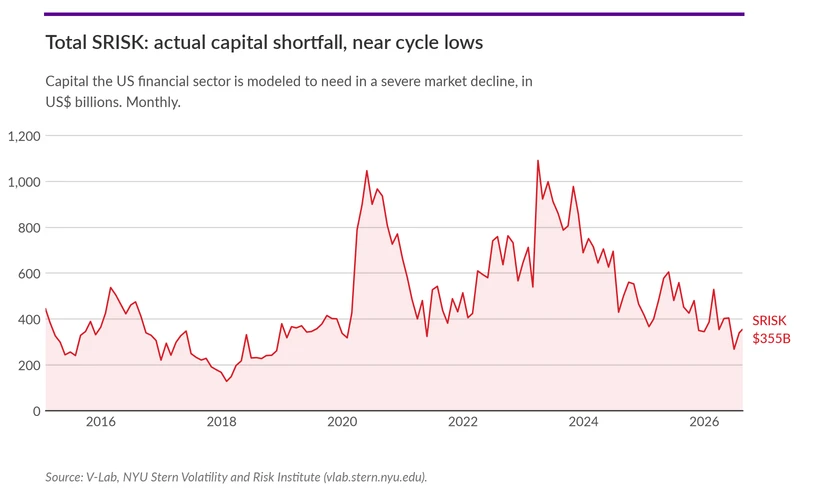
3. SRISK capacity: the sector's equity cushion is at a record high
SRISK capacity represents the equity buffer available to absorb losses — not a shortfall, but the opposite: more capacity means more resilience. It has climbed to a series-record $2.09 trillion, consistent with rising market valuations and equity issuance across the period. Read together, points 2 and 3 describe a financial sector with both a smaller modeled shortfall and a larger cushion — an unambiguously favorable combination in this model's own terms.
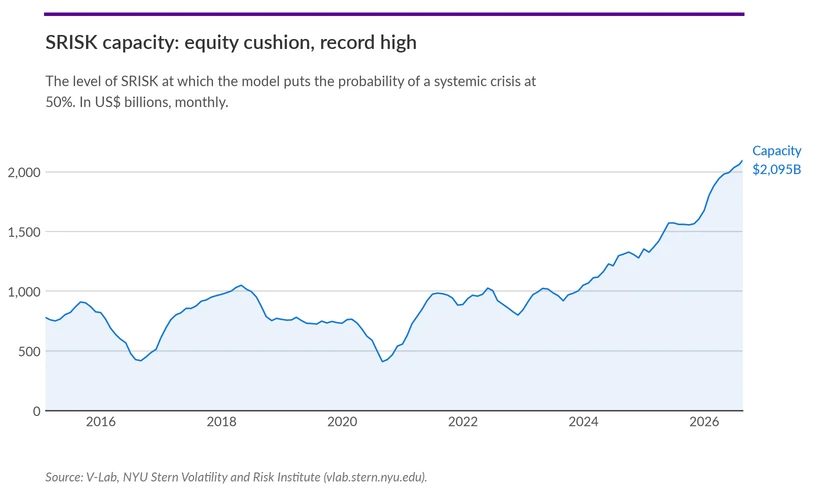
4. Modeled crisis probability: a record low
V-Lab's modeled probability of a systemic crisis has fallen to 1.0% as of August 2026 — the lowest reading in the 2015–present series. This is consistent with, not contradictory to, the SRISK series above: falling shortfall, rising cushion, and falling crisis probability all move together, because they share the same underlying market-price inputs.
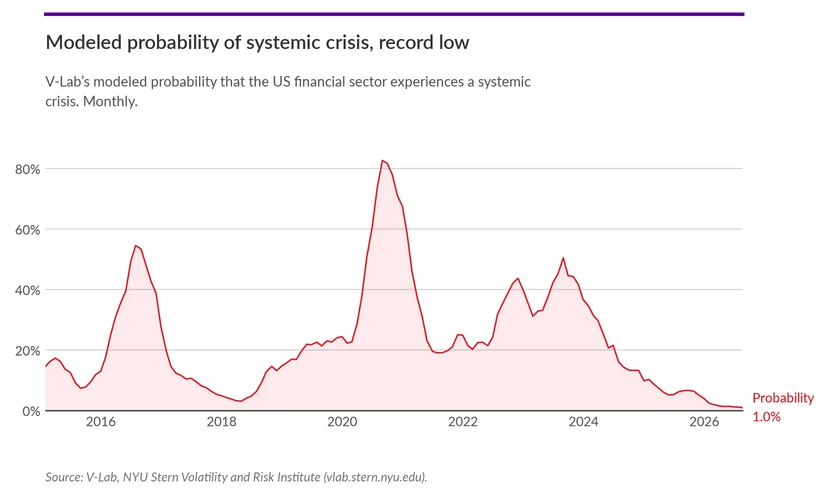
5. So where is the disconnect, not just data points?
On the metrics: Volatility- and option-price-based risk measures are backward-looking: they describe how much prices have recently moved, not how much leverage, concentration, or balance-sheet exposure has built up in the system. Because many downstream risk estimates (including probability-of-crisis models) take volatility as an input, a sustained quiet period can compress the estimated odds of a crisis even as the underlying capital cushion erodes.
Because every measure here is derived from market prices — equity volatility, cross-market co-movement, and market-value-based leverage — they can only register risk once it has begun to move prices. Risks that build up gradually or sit outside public markets do not show up in SRISK, COVOL, or implied volatility until a market event forces repricing. Candidates commonly raised in this category include concentration in a small number of mega-cap technology stocks, leverage tied to AI infrastructure buildout sitting partly outside public balance sheets, private credit growth with limited market pricing, and sovereign debt sustainability — none of which this data set speaks to directly. The gap, then, is not between different V-Lab series (they agree), or between those measures and what is priced in the market. Rather, it is between a comprehensive family of market-priced risk measures and the universe of risks that have not yet been priced by markets at all.
Caveat: this document does not independently verify which, if any, real-world risks are currently underpriced — that judgment is inherently contested and outside what this data set can establish. What the data supports directly is only that V-Lab's market-based measures are internally consistent and currently low, and that such measures are structurally limited to what markets have already begun to price.
6. Where are the risks not priced, and how long can that last
The real disconnect is between global events and priced risk in markets.
Lately financial, geopolitical, climate, cyber and health risks – all topics we cover in the VRI -- have been rising. Global sovereign yields are rising with fiscal risk; the Japanese yen has been falling, wars in Ukraine and the Middle East are intensifying or stalemated, oil prices have risen $25-$30/bbl.in the past six months and V-lab data show that the volatility of oil prices is also significantly higher; heat and wildfire risk is escalating; cyber attacks are increasing, and infectious disease – Ebola, measles - is increasing. Economic policy uncertainty and actions in the Trump regime are amplifying these challenges.
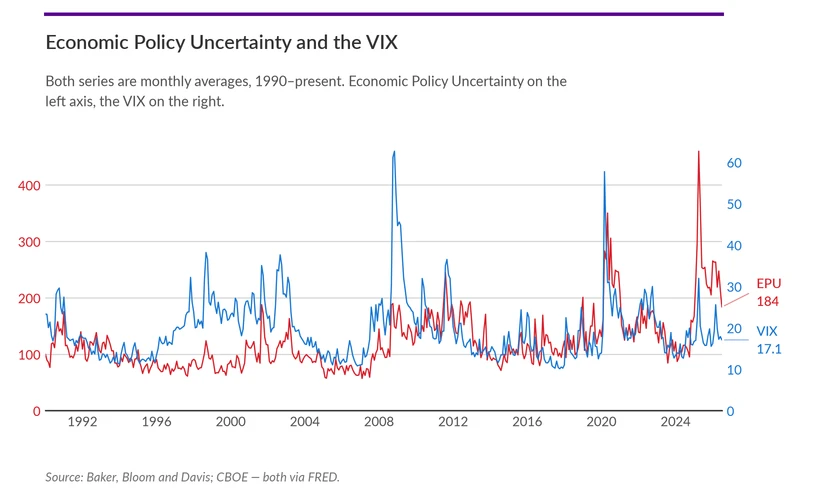
That disconnect hasn’t always been present. In the past, policy uncertainty and volatility were highly correlated, as one followed the other. In fact, the longer-term correlation between policy uncertainty and equity vol is positive:
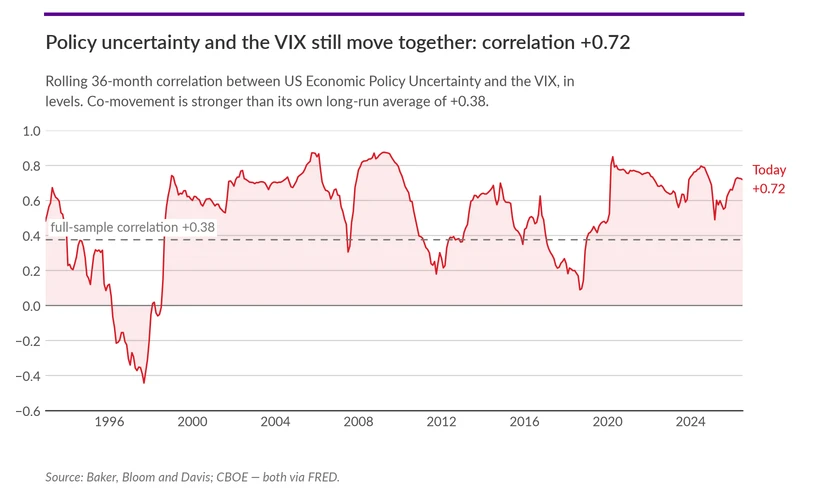
Yet today, risk in financial markets, measured by volatility and option prices, has been falling or stable. Equity valuations have hit record highs and investors seem to be betting on more of the same. The past connection between policy uncertainty and volatility appears to be broken.
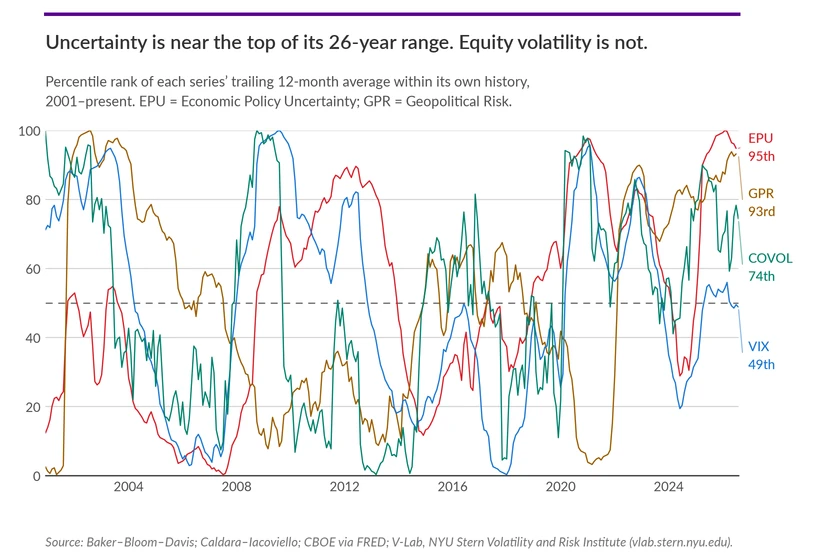
6. So what explains this apparent disconnect? There appear to be four answers:
1. Equities are benefitting from super strong earnings, overcoming the hurdles enumerated above.
2. Investors are apparently betting that any Fed action to bring down inflation will be modest, if any, because they agree with Fed Chairman Warsh that the productivity benefits of AI will bring inflation down.
3. Investors are apparently betting that Trump policies that favor investors will continue, and that the Trump regime will back down from today’s policies if they adversely affect markets – an example of TACO (Trump Always Chickens Out).
4. While expectations of enduring fiscal deficits are worrying bond investors, they may be positive supports for forecasts of strong earnings growth among companies.
Can this go on indefinitely? Our answer is no. Investors would be wise to reduce risk by taking out insurance – which, given low levels of volatility, is inexpensive -- and preparing for these developments – the buildup of leverage in a low-volatility environment -- to affect markets. What would be catalysts? We can think of three that would challenge investor expectations:
1. Inflation continues to edge higher and the Fed adopts a tighter monetary policy.
2. Confidence in Trump policies and unchecked fiscal concerns push 10 year Treasuries beyond 5%
3. Democrats take both House and Senate in the midterm elections.