Sustainable Market Share Index™
CSB partnered with Circana (formerly IRI) for its annual analysis of consumer purchasing data for consumer packaged goods marketed as sustainable.
Sustainable Market Share Index™
The Sustainable Market Share Index is an annual analysis of the latest national purchasing data for consumer packaged good (CPG) products marketed as sustainable. NYU Stern Center for Sustainable Business (CSB) partners with Circana (formerly IRI), who generously donates the purchasing data of products marketed with sustainability attributes in 36 CPG categories (excluding alcohol and tobacco), comprising ~40% of the total US CPG market in sales from 2013-2025. CSB uses this data to report on the market share for sustainable products and what factors are contributing to its continued growth. Pioneered by Senior Scholar Randi Kronthal-Sacco, each year's report builds on previous analysis and addresses new research questions based on current trends. For the first time in 2024, CSB applied the methodology to two European markets, analyzing 34 categories in Germany and the U.K. Click here to read the full 2025 report.
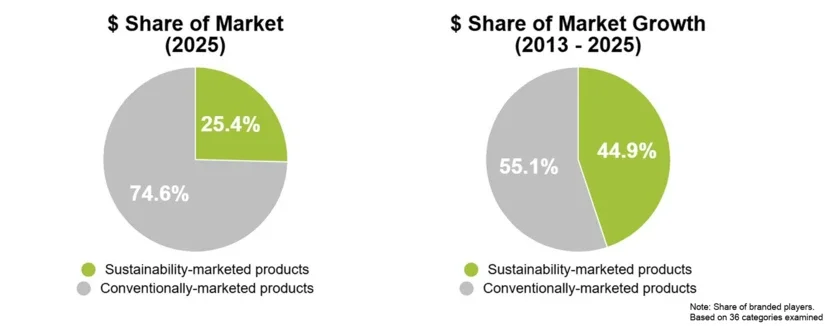
The 2025 Sustainable Market Share Index™ finds that products marketed as sustainable are responsible for 44% of the growth in consumer packaged goods (CPGs) from 2013 to 2025, and market share growth continues year over year.
- Branded products marketed as sustainable now hold a 25.4% market share, up +1.6 percentage points versus the prior year despite continued high inflation, strong store brand performance, and market and economic uncertainty.. The market share of sustainable products has increased 10.8 percentage points since 2013.
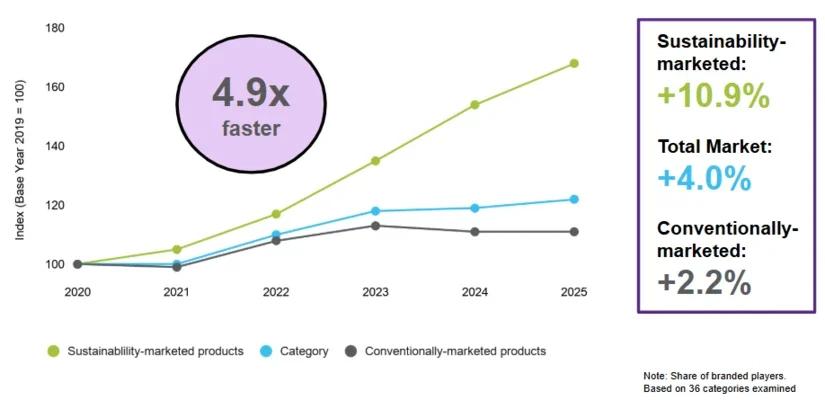
- Products marketed as sustainable achieved a 5-YR CAGR of 10.9% vs. 4.0% for the total CPG market and just 2.2% for conventionally-marketed products.
*excludes alcohol and tobacco sales, share of branded products only
Despite perceptions of corporate retreat on sustainability, consumer demand is accelerating,” said Randi Kronthal-Sacco, Senior Scholar at the NYU Stern Center for Sustainable Business (CSB), who leads the research initiative. "The data tells an irrefutable story that sustainability-marketed products are consistently taking share from conventional ones across nearly all categories.
Despite sustainability-marketed products accounting for 25.4% of the market, they delivered an outsized 44.9% of the CPG market growth (2013-2025).
Sustainability-marketed products enjoy a 10.9% 5-year CAGR, significantly higher than conventionally-marketed products and the market (2.2% and 4.0% respectively), and are growing 4.9 times faster than their conventional counterparts.
Sustainability-marketed products enjoy an average of 26.6% price premium over conventional counterparts, but that number has decreased and stabilized since its peak.
The U.K. and Germany, have significantly higher shares of branded products marketed as sustainable (36.8% and 42% respectively) compared to the US*.
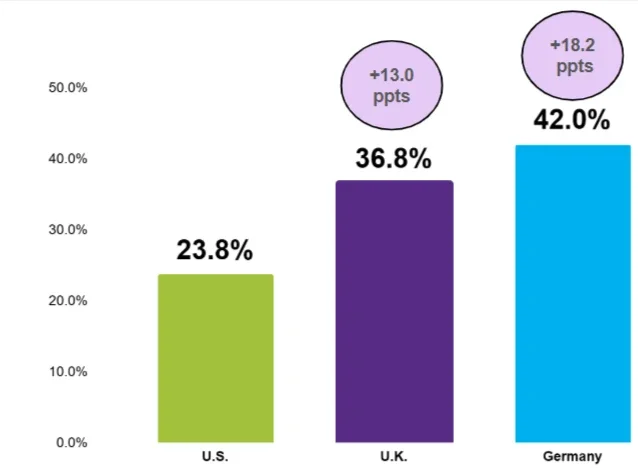
*UK and German share based on analysis of 34 categories. Analysis completed with 2024 data.

View the Full Research Findings
Research Questions
Publications & Press